InfoGraphic: Lebanese Americans
No matter who you are or where you come from, it is difficult to quantify a lifetime of experiences and choices. How do we put numbers against all the decisions we make in our lives? Part of the mission of the Center is to be able to tell the stories of the Lebanese-Arab diaspora, so that we need not only rely on numbers to paint a portrait of a community. This sentiment was echoed by Dr. Akram Khater recently into a keynote address to Lebanese Collegiate Network (LCN). There are so many ways to characterize the Lebanese diaspora in the United States. Demographics are just one way to further understand the community, and to ask questions of the data itself. Here at the Center, we long for data like the one we’ve curated for all of you. So, numbers help! Overview of the survey In 2013, the American Community Survey (ACS), which is part of the U.S. Census Bureau, finished a 3-year study that sampled the U.S. population on a range of topics. Here’s what happens: ACS sends out 3 million surveys each year for 3 years. By the end of the 3 years, that’s a total of 9 million sample surveys, which amounts to a whole lot of data! Analysts and information specialists spend significant time parsing through the data to provide clear numbers associated with lifestyle choices, decisions and experiences of communities throughout the country. After that, they do it all over again, because ACS is an ongoing survey that contributes to datasets each year. Among other things, information from the surveys helps determine how $400+ billion in state and federal funds are distributed each year. ACS collects data on a range of topics including (via source):
- age
- sex
- race
- family and relationships
- income and benefits
- health insurance
- education
- veteran status
- disabilities
- where you work and how you get there
- where you live and how much you pay for some essentials
Highlights of the survey Rather than reading through pages of data analysis, we created a handy infographic for all of you to check out! You can view it on our website.
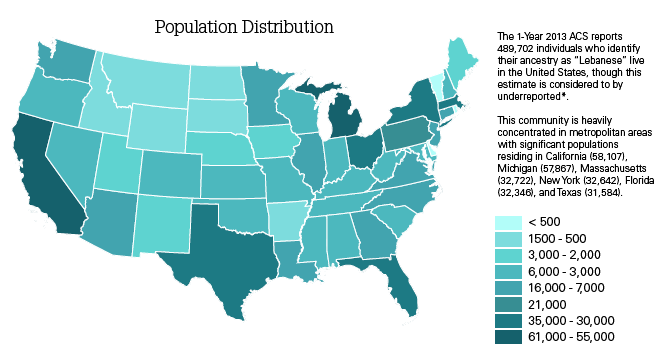
- The highest concentration of the community is in 7 states: Michigan, California, Massachusetts, Florida, Texas, Ohio, and New York have the highest concentrations of Lebanese-identified residents in the country.
- Most of the community is naturalized: The majority of foreign-born Lebanese are naturalized citizens.
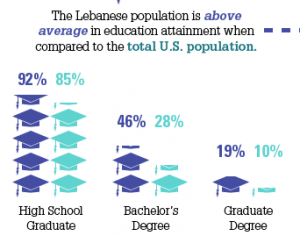
- We value education very highly: In high school, undergraduate education, and graduate education, the community ranks consistently higher than the national average.
- Our professions are clustered: More than the national average, the Lebanese community holds more jobs in management, business, science, and art than other areas of expertise.
Where the survey fails With any large data set, it is important to also consider what the survey fails to tell us. While ACS sounds like a comprehensive survey, it means that for a small population like the Lebanese-American one, the sample undercounts the community. For larger populations, the sample may be more accurate or even inflated. For smaller communities, the sample underrepresents them. Many scholars content that the underrepresentation may be as much as 30% but there is no way to confirm that number. Still, there is so much valuable information in this survey, if even as a starting point for a fuller understanding of the community living in the United States. Again, you can view the InfoGraphic on our website. Take a peek and let us know what you think!
- Categories: